


Abstract
Background: Since publication of the human genome in 2003, geneticists have been interested in risk variant associations to resolve the etiology of traits and complex diseases. The International HapMap Consortium undertook an effort to catalog all common variation across the genome (variants with a minor allele frequency (MAF) of at least 5% in one or more ethnic groups). HapMap along with advances in genotyping technology led to genome-wide association studies which have identified common variants associated with many traits and diseases. In 2008 the 1000 Genomes Project aimed to sequence 2500 individuals and identify rare variants and 99% of variants with a MAF of <1%.
Methods: To determine whether the 1000 Genomes Project includes all the variants in HapMap, we examined the overlap between single nucleotide polymorphisms (SNPs) genotyped in the two resources using merged phase II/III HapMap data and low coverage pilot data from 1000 Genomes.
Results: Comparison of the two data sets showed that approximately 72% of HapMap SNPs were also found in 1000 Genomes Project pilot data. After filtering out HapMap variants with a MAF of <5% (separately for each population), 99% of HapMap SNPs were found in 1000 Genomes data.
Conclusions: Not all variants cataloged in HapMap are also cataloged in 1000 Genomes. This could affect decisions about which resource to use for SNP queries, rare variant validation, or imputation. Both the HapMap and 1000 Genomes Project databases are useful resources for human genetics, but it is important to understand the assumptions made and filtering strategies employed by these projects.
Introduction
The field of human genetics has rapidly developed in the past few decades. The desire for precise genomic mapping has encouraged the development of association studies, from genome-wide linkage studies to both low and high throughput single nucleotide polymorphism (SNP) genotyping and, most recently, high throughput DNA sequencing. At each stage of progression, the researcher has been better able to narrow disease susceptibility genetic regions and/or identify causal variants associated with disease. The first genetic linkage map was published in 1987 and based on restriction fragment length polymorphisms (RFLPs).1 RFLPs are DNA polymorphisms that disrupt (by either creation or destruction) restriction endonuclease recognition sequences. In this first map, only 393 bi-allelic RFLPs were used. Second generation linkage maps were based on microsatellites, which are short tandem repeated DNA sequences present throughout the genome. The first published study using microsatellites included 814 polymorphic markers.2 The third generation linkage maps were created using SNPs. These high density maps were developed by the International HapMap Consortium (haplotype mapping). HapMap aimed to compare genetic sequences of different individuals and identify chromosomal regions where genetic variants were shared. These variations quickly became the core around which genome-wide association studies (GWAS) were built. Researchers believed that these variations among individuals could explain the heritability of common disease. After several years of moderately successful GWAS, a group of researchers decided that a more in-depth look at variation, including rare variation, was necessary to explain additional disease heritability. The 1000 Genomes Project aimed to sequence 2500 individuals and gather information on variants down to 1% allele frequency with the goal of providing a more extensive catalog of variation to the scientific community.
In addition to cataloging human variation, both databases serve many other purposes. For example, GWAS were possible because of the linkage disequilibrium information calculated from the SNPs in HapMap. Published sequencing studies are often filtered by variants in 1000 Genomes to reduce the number of variants used in association tests, since the individuals in 1000 Genomes are presumably healthy controls and thus variants detected in these data are unlikely of importance for disease. Both of these resources have enhanced the study design and analysis pipelines for common and rare variant association studies.
The HapMap project was launched in October 2002 on the heels of the completion of the human genome sequence. The project was designed to build a database of common sequence variation, to determine allele frequencies, and to empirically determine the linkage disequilibrium relationships across the genome. To date, there are three phases of HapMap. The details are listed in table 1.3,4
HapMap details
| No. of SNPs genotyped | Targeted SNPs | Populations studied | |
|---|---|---|---|
| Phase I | 1 million | Prioritized coding SNPs to attain 1 SNP for each 5 kb region | CEU, YRI, CHB, JPT |
| Phase II | 3 million | Prioritized non-synonymous SNPs in coding regions | CEU, YRI, CHB, JPT |
| Phase III | 1.4 million | Prioritized rare variants | CEU, YRI, CHB, JPT, ASW, CHB, GIH, LWK, MXL, MKK, TSI |
SNP, single nucleotide polymorphism.
In 2008, the HapMap project catalog contained 3.5 million commonly occurring genetic variants across several populations. The allele frequencies and correlation patterns were critical for the development and success of GWAS. However, to expand the investigation of causal variants to include rare variation, more research was required. Using sequencing technology, researchers are able to identify novel or rare variants. Sequencing enables scientists to pinpoint functional variants from association studies, improve the knowledge available to researchers interested in evolutionary biology, and may lay the foundation for predicting disease susceptibility and drug response. The 1000 Genomes consortium materialized to address these needs, primarily by providing a sequence reference database. Their aim has been to ‘provide a deep characterization of human genome sequence variation as a foundation for investigating the relationship between genotype and phenotype.’ The pilot phase of the project, which included three subprojects, provided the first data release. The subprojects were planned to achieve their aims through evaluation of sequencing technology and to develop analytical pipelines for alignment, quality control, data management, and statistical analysis.5 Details about the pilot data from the 1000 Genomes Project are shown in table 2. Review of the pilot data shows that the project successfully catalogs the vast majority of common variation. Durbin et al reported that over 95% of the currently accessible variants found in any individual were present in the pilot data.6
Details for three pilot projects initiated by the 1000 Genomes Project
| Pilot data sets | Populations | Samples | Coverage |
|---|---|---|---|
| Trio | 2 | 6 | 20–40× |
| Low coverage | 4 | 179 | 2–4× |
| Exon (8140 exons, ∼5% of exome) | 7 | 697 | 20–50× |
| Pilot data sets | Populations | Samples | Coverage |
|---|---|---|---|
| Trio | 2 | 6 | 20–40× |
| Low coverage | 4 | 179 | 2–4× |
| Exon (8140 exons, ∼5% of exome) | 7 | 697 | 20–50× |
To date (August 2011), the full 1000 Genomes Project data includes SNP calls, exome alignments, and genotypes for 1185 individuals. The end goal is to sequence approximately 2500 de-identified subjects from 25 populations worldwide using next-generation sequencing technology. In the ‘low-coverage’ full project data, the current coverage estimate is 7.7× (±4.2) and includes 15 world populations.6 In this analysis, we downloaded an earlier release of the full project data (released October 2010) which included 629 individuals from 15 world populations (see table 3).
Details for 1000 Genomes Project full project data (sequence index 2010.08.04)
| Continental groups | Ethnicity breakdown | Total |
|---|---|---|
| AFR | 78 YRI+67 LWK+24 ASW+5 PUR | 174 |
| EUR | 90 CEU+92 TSI+43 GBR+36 FIN+17 MXL+5 PUR | 283 |
| ASN | 68 CHB+25 CHS+84 JPT+17 MXL | 194 |
| Total number of unique individuals | 629 |
| Continental groups | Ethnicity breakdown | Total |
|---|---|---|
| AFR | 78 YRI+67 LWK+24 ASW+5 PUR | 174 |
| EUR | 90 CEU+92 TSI+43 GBR+36 FIN+17 MXL+5 PUR | 283 |
| ASN | 68 CHB+25 CHS+84 JPT+17 MXL | 194 |
| Total number of unique individuals | 629 |
AFR, African; ASN, Asian; EUR, European.
Both HapMap and 1000 Genomes have proved very valuable in the field of human genetics and have paved the way for:
Designing and refining genotyping platforms (HapMap) and next-generation sequencing technologies (1000 Genomes)
The development of many computational pipelines
The creation of a control for comparison to be used with developing technology
Defining linkage disequilibrium patterns and consequently the ability to choose tag SNPs (integral for GWAS)
Unbiased allele frequency estimates
Estimating ancestry proportions
Identifying population substructure
Studying genomic structure, recombination rates, and mutation rates.
These resources are invaluable tools in genetics research and their functionality has quite a bit of overlap. When considering which database to reference, one might base one's decision on the newest release, total number of variants, or even ethnicities included. For example, if a researcher's interest was rare variants, he/she might automatically assume that data from the 1000 Genomes Project would be the variation catalog of choice. The 1000 Genomes Project aimed to provide characterization of over 95% of variants in accessible genomic regions that have an allele frequency of 1% or higher.6 In the previous example, presuming that the 1000 Genomes Project data included more rare variants than HapMap would be a correct assumption; the 1000 Genomes Project pilot data do indeed capture more rare variation than HapMap. However, not all rare variants found in HapMap have been found in the 1000 Genomes Project catalog. Therefore, if one is interested in rare variants, it might be beneficial to investigate both resources. An example of this is shown in figure 1, which shows a screen shot from the NCBI browser (taken in October 2010) of a region on chromosome 7. It lists the known variants by chromosome position, rs id, functional change, alleles, and many other identifying characteristics. It also includes a validation column which provides links and details about the validation status of each given variant. Of particular interest is variant rs2072413. It was validated in HapMap but was not sequenced by the 1000 Genomes Project (at this time, only pilot data from 1000 Genomes were available on NCBI). If this SNP was of interest, it would be important to consider the HapMap data, including rare variants. This was somewhat surprising, and we felt that it might be pertinent to determine how pervasive the differences were between HapMap and 1000 Genomes Project data.
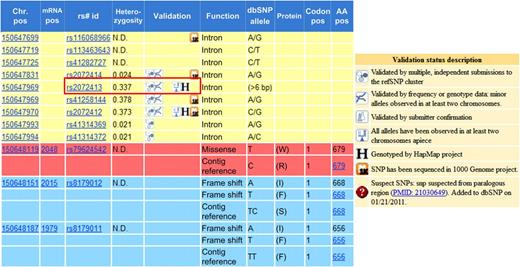
Variants in HapMap and 1000 Genomes Project data. The left box shows an enhanced screenshot from the NCBI browser. rs2072413 shows that variants in HapMap are not always found in 1000 Genomes Project data. For reference, the validation status descriptions are shown in the box on the right. SNP, single nucleotide polymorphism.
The goal of this work is to quantify the number of variants (with particular focus on rare variants) that were cataloged in HapMap but not found in 1000 Genomes data. The initial phase of this research was performed using 1000 Genomes Project low coverage data in CEU and YRI individuals. The follow-up phase was carried out using the full data from the 1000 Genomes Project which contained sequence data from 174 individuals from African populations, 283 individuals from European populations, and 195 individuals from Asian populations (see breakdown by ethnicity in table 3).
Methods
Overlap quantification between HapMap and 1000 Genomes Project pilot data
To compare the two resources, we downloaded the data from each database directly, and established data tables within a MySQL relational database system. We ran queries to examine the overlap between the two resources. Specifically, we downloaded the merged phase II+phase III (release 28) HapMap data for CEU and YRI (http://hapmap.ncbi.nlm.nih.gov/downloads/frequencies/2010-08_phaseII+III/). We downloaded 1000 Genomes Project pilot data VCF files for CEU and YRI from the 1000 Genomes Project website (ftp://ftp-trace.ncbi.nih.gov/1000genomes/ftp/pilot_data/release/2010_07/low_coverage/snps). Genomic coordinates of SNPs from both data sets are from NCBI build 36. We compared the overlap of variants between the two resources using NCBI 36 chromosome and base pair location. Query results contained the number and percentage of variants common between both databases. Then using a simple calculation, we obtained the number and percentage of HapMap variants missing from the 1000 Genomes Project database. We discuss the number of HapMap variants that were exclusive to HapMap below.
Overlap quantification between HapMap and 1000 Genomes Project full data
In the second step of this analysis, we used the merged phase II+phase III (release 28) HapMap data for CEU and YRI (independently). Since the data were build 36 and HapMap, to date, has not released build 37 data, yet 1000 Genomes Project full data is released in build 37. Thus, we ran the HapMap data through the UCSC LiftOver7 algorithm to obtain the HapMap data in build 37 coordinates. Second, we used the 1000 Genomes Project full project data from the 1000 Genomes website (the available version from August 2010). The data were combined data from several ethnicities (see table 3). We kept the complete list (including all individuals for the full project data) of variants for comparison. It is important to note that the combined ethnicity data set from 1000 Genomes is different from the single ethnicity download performed in the pilot analysis.
First, we compared CEU HapMap variants with the full project data, and then performed the same analysis comparing YRI HapMap variants with the full project data. The output included the number of variants that were common between HapMap and 1000 Genomes Project full project data. From this, we obtained the number and percentage of variants exclusive to HapMap.
Results
In the first stage of analysis, we compared HapMap and 1000 Genomes Project pilot data. When comparing the CEU populations, only 69% of variants in HapMap were also found in 1000 Genomes Project pilot data. When comparing the YRI populations, only 75% of variants in HapMap were also found in 1000 Genomes Project pilot data. These percentages were much lower than the expected 90%–95% overlap.
First, we wanted to investigate which types of alleles were the uncommon variants excluded from 1000 Genomes Project pilot data. The incorporation efficiency of many sequencing reactions is greatly affected by strand base composition and more complex sequence, such as repetitive and/or GC rich regions, can lead to higher error rates. Therefore, if the missing variants were primarily GC rich, missingness in 1000 Genomes pilot data might be due to sequencing errors. Therefore, we plotted the reference allele type frequency (for the HapMap exclusive data) by chromosome (see figure 2).
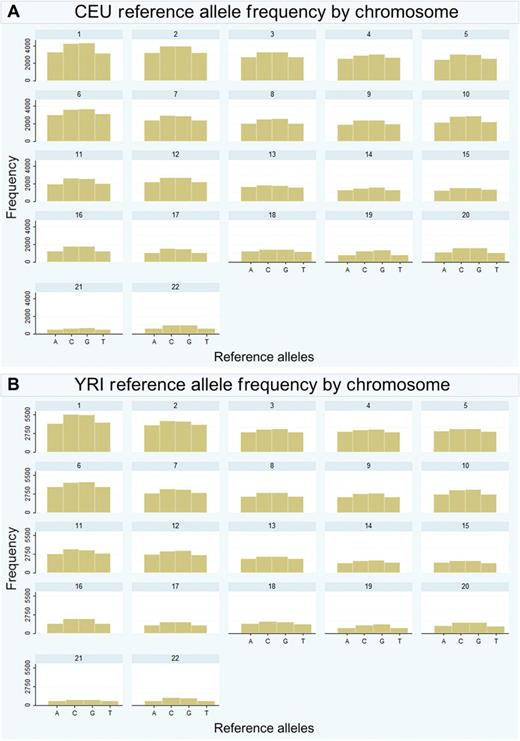
Reference allele frequency in the HapMap exclusive data, by chromosome in CEU (A) and YRI (B).
Next, we investigated the distribution of allele frequencies. A quick query showed that HapMap contains many monomorphic alleles for a given population. 1000 Genomes Project pilot data do not retain monomorphic alleles in the data. After filtering out the monomorphic variants in the CEU individuals, 93% of variants in HapMap were also found in 1000 Genomes Project pilot data. After filtering out the monomorphic variants in YRI individuals, 92% of variants in HapMap were also found in 1000 Genomes Project pilot data. Figure 3 shows the distribution of HapMap exclusive reference allele frequencies by percentage of exclusive variants.
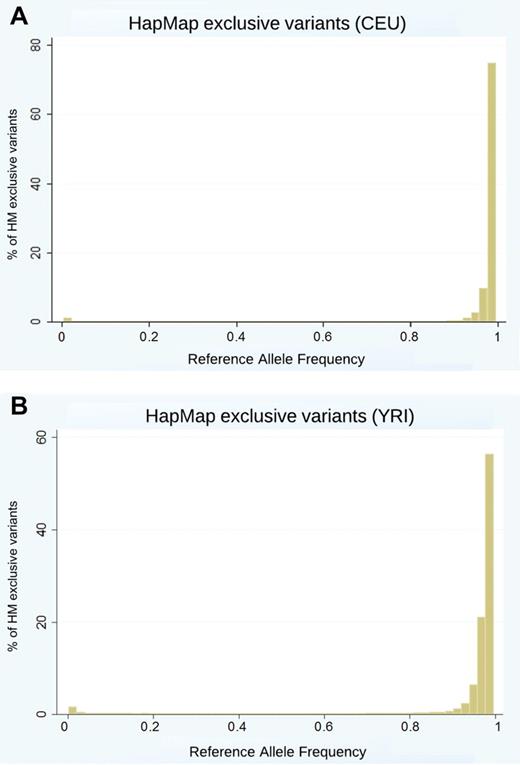
Distribution of reference allele frequencies (most often the major allele frequency) of HapMap (HM) exclusive variants after filtering out any fixed alleles in CEU (A) and YRI (B) populations.
In the CEU population, approximately 75% of the exclusive variants (those missing from 1000 Genomes Project pilot data) had a reference allele frequency of >98%, which corresponds to a minor allele frequency (MAF) of <2%. In the YRI population, approximately 55% of the exclusive variants had a reference allele frequency of >98%, which corresponds to a MAF of <2%.
Figure 3 shows that ‘missing’ variants in 1000 Genomes Project pilot data are due to alleles of low frequency. After filtering out monomorphic and uncommon (<5% MAF) variants, the number of exclusive variants fell to 1% and 2% in CEU and YRI populations, respectively. The data are shown in table 4.
Comparison of HapMap and 1000 Genomes Project pilot data
| Population | Raw data | Filtered out fixed alleles (fixed: AF=0 or 1) | Filtered out uncommon alleles (uncommon: AF<0.05 or >0.95) |
|---|---|---|---|
| CEU | 0.6858 | 0.9314 | 0.9894 |
| YRI | 0.7543 | 0.9234 | 0.9841 |
| Population | Raw data | Filtered out fixed alleles (fixed: AF=0 or 1) | Filtered out uncommon alleles (uncommon: AF<0.05 or >0.95) |
|---|---|---|---|
| CEU | 0.6858 | 0.9314 | 0.9894 |
| YRI | 0.7543 | 0.9234 | 0.9841 |
The table shows the percentage of variants in HapMap that were also represented in 1000 Genomes (and therefore, were common to both). The first column indicates the two populations used in this study; the second column shows the calculated percentage (of HapMap) common to both databases using the raw data; the third and fourth columns indicate how the HapMap list of variants was filtered before comparison.
To further illustrate the point, figure 4 shows the distribution of total HapMap variants compared to those also found in 1000 Genomes pilot data. The data used in this example are from chromosome 1 in CEU data. The tan bars represent the total number of variants in HapMap (if applicable, after filtering). The green bars represent the total number of variants in HapMap that are common to 1000 Genomes Project pilot data. For reference, the total number of variants on chromosome 1 in the 1000 Genomes Project pilot data is 605 756 (which is shown as a gray line in the figure).
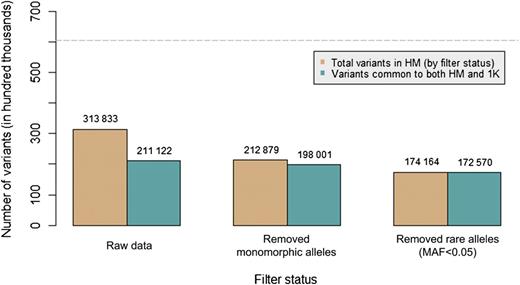
Total number of HapMap variants before and after filtering using CEU samples on chromosome 1. The y-axis shows the total number of variants (by hundred thousand). The tan bars indicate the number of HapMap variants left after an allele frequency filter is applied (if applied). The green bars indicate how many of those variants are present in 1000 Genomes Project pilot data. The numbers above each bar indicate the bar height, that is, the number of variants. For reference, the light gray line demonstrates the total number of variants on chromosome 1 in 1000 Genomes Project pilot data (approximately 605 000).
To be thorough, we performed a similar analysis to that described above, but instead compared HapMap data with the 1000 Genomes full project data. The results are shown in table 5.
Comparison of HapMap and 1000 Genomes Project full project data
| Population | Raw data | Filtered out fixed alleles (fixed: AF=0 or 1) | Filtered out uncommon alleles (uncommon: AF<0.05 or >0.95) |
|---|---|---|---|
| CEU | 0.8784 | 0.9884 | 0.9930 |
| YRI | 0.8778 | 0.9859 | 0.9932 |
| Population | Raw data | Filtered out fixed alleles (fixed: AF=0 or 1) | Filtered out uncommon alleles (uncommon: AF<0.05 or >0.95) |
|---|---|---|---|
| CEU | 0.8784 | 0.9884 | 0.9930 |
| YRI | 0.8778 | 0.9859 | 0.9932 |
The table shows the percentage of variants in HapMap that were also represented in 1000 Genomes (and therefore, were common to both). The first column indicates the two populations used in this study; the second column shows the calculated percentage (of HapMap) common to both databases using the downloaded data; the third and fourth columns indicate how the HapMap list of variants was filtered before comparison.
Discussion
In the initial stage of analysis, we compared the variants between HapMap and 1000 Genomes Project pilot data in both the CEU and YRI populations. We expected complete overlap of the HapMap variants in 1000 Genomes and were surprised that 30% of the HapMap variants were missing. We were curious as to why some variants are ‘missing,’ and if they were missing at random in the 1000 Genomes Project pilot data. We first examined SNP coverage, with the hypothesis that the low-coverage pilot data (2–6× coverage) simply could not sequence the ‘missing’ variants with enough confidence to meet quality control standards. Second, we considered the possibility that the ‘missing’ variants were false positive discoveries in HapMap. However, this was unlikely since the HapMap SNPs are far better validated than those from 1000 Genomes.8 Another factor could be chromosomal location. Are the HapMap exclusive variants in a particular region of the chromosome or do they have particular characteristics or alleles? We visualized the missing variants across the chromosome to see if there were peaks around certain locations (ie, in GC rich regions or near the centromere or telomere). There was no visible pattern of ‘missingness’ along the length of the chromosome (data not shown). Could these results be replicated in other populations? We wanted to investigate if there was a pattern of allele type in the HapMap exclusive data. Figure 2 shows the reference allele type frequency by chromosome. There are more ‘missing’ GC (share triple hydrogen bond) pairs than AT (share double hydrogen bond) pairs across both populations and in every chromosome. However, this is representative of the distribution of allele types in the human genome and so is not surprising.
Next, we investigated the allele frequency distribution of the missing variants. We started by removing monomorphic and very rare variants (MAF <0.01). As shown in figures 3 and 4, and table 3, only after filters are used to remove fixed or uncommon variants in HapMap, do 1000 Genomes Project pilot data cover the expected number of variants in HapMap (99%). This is surprising since the 1000 Genomes Project reports that the pilot data cover 95% of all variation down to 1% allele frequency (and down to 0.1% allele frequency in coding regions). Therefore, most HapMap exclusive variants were fixed or uncommon variants. This raises two important points: (a) HapMap contains monomorphic alleles; and (b) HapMap contains uncommon variants that have not been validated in 1000 Genomes Project pilot data. To address the first point, it is surprising that a catalog of variation contains alleles that are themselves not variable. This could be a result of how the data are stored; many of these variants are undoubtedly polymorphic in other populations. SNPs are population specific, but, for example, if one downloads CEU variants from the HapMap website, monomorphic SNPs (specifically monomorphic in the CEU population) are not automatically filtered out. Note that this is the case even in imputed lists that are available online. To be included in an imputation SNP list, SNPs must pass quality control in every population and be polymorphic in at least one population. One can use HapMart, which is an extension of HapMap that allows the user to apply various filters to the data before download (one of which is to filter out monomorphic and/or rare variants). As for the second point, we cannot assume that 1000 Genomes Project pilot data include all of the variation cataloged in HapMap. The rare variants could have been completely missed or eliminated during quality control testing. In order to determine if this is a function of coverage or of number of individuals sequenced, this study was repeated using the 1000 Genomes full project data.
Because there were still quite a few HapMap variants missing from the 1000 Genomes resource, we decided to perform a second analysis using the 1000 Genomes Project full project data. One hypothesis was that these missing variants were due to the low coverage data being incomplete (only 60 individuals to represent a population). With more individuals, perhaps some of the missing rare variants would be captured. This was certainly the case, when the raw data from the two analyses were compared. In the first analysis (using pilot data) over 30% of the variants listed in HapMap were missing from the 1000 Genomes pilot data. In the second analysis, only a little over 10% of the variants listed in HapMap were missing from the 1000 Genomes full project data. After a filter was incorporated to remove fixed and then additionally rare variants, the overlap was approximately 99% in both cases (see table 5). This most likely can be explained in two ways. First, the results suggest that the 1000 Genomes Project full data are more complete in terms of cataloging rare variants. Second, the multiethnic data from the 1000 Genomes Project include more rare variants than any one single population. The latter is certainly true, and perhaps some of the variants missing in the pilot data for CEU or YRI are more prevalent in other ethnicities, and so were more likely to be included in the multiethnic full data.
The field of human genetics is quickly adopting the usage of online database resources and catalogs. Since the start of HapMap in 2003 to the expected completion of the 1000 Genomes Project in 2012, these research assets have greatly altered the course of genetics research and the community's resolution to define genetic influences on disease. However, it is important to be vigilant of the validity of information, particularly in very competitive and fast-paced fields of research. Recently, Nothnagel et al published a review of three common next-generation sequencing technologies using aligned DNA sequences from two HapMap samples included in the 1000 Genomes Project. After removing the validated HapMap variants (present in HapMap), they statistically evaluated the validity of novel single-nucleotide variants. They found an alarming proportion of false positives (3%–17%); however, that number was reduced to 1%–3% if called by more than one platform.8 Next-generation sequencing provides both incredible opportunities and complex challenges for researchers. Due to cost and technology requirements (equipment, database resources, and technicians), many scientists will opt to pay another institution or group to generate their sequence data. In addition, more reference data sets will likely become available to researchers (1000 Genomes Project). In both of these scenarios, the researcher will have little to no control over data generation and quality control. Knowledge of error estimates and validity for ‘novel’ single-nucleotide variants will be incredibly important to those performing statistical analysis.8
Conclusion
Next-generation sequencing projects are revolutionizing our understanding of genetic variation. The quality of data from the next-generation technology and the availability of analysis tools are both rapidly increasing. Just considering the pilot data from the 1000 Genomes Project, this new resource has provided the location, allele frequency, and local haplotype structure of approximately 15 million SNPs. The number of novel variants is constantly increasing and many believe that the 1000 Genomes Project could potentially overshadow the utility of HapMap. In this study, we compared variants in HapMap with those present in 1000 Genomes data (both in the low-coverage pilot and full data sets). We found that 1000 Genomes Project pilot data only cover 99% of variants in the merged phase II+phase III HapMap database if one filters out uncommon (<5% MAF) and monomorphic variants. If these filters are not applied, most of the variants only seen in HapMap have a MAF of <5%. Performing the comparison using the 1000 Genomes Project full project data instead of pilot data, we found considerably more overlap between the two resources. This has implications for those interested in performing imputation with uncommon variants as well researchers interested in SNP validation or researching a candidate gene. We know that rare variant frequencies are heavily dependent on the population. Perhaps the most thorough imputation list would be a combined data set between the two catalogs. There are several other reasons researchers might prefer a comprehensive list of variants: SNP validation, candidate gene research, and to better understand ancestry and evolution. Both of these resources are incredibly powerful and useful in the field of genetics, so it is important to consider the limitations of the technology and how each might best benefit your research.
Contributors
CB and MR designed the analysis. CB performed the comparisons and prepared the manuscript. ET aided CB in developing appropriate SQL databases. WB contributed frequent advice and interpretation. All authors regularly discussed the results and implications of the project.
Funding
This project was funded by NIH grant LM010040 and Public Health Service award T32 GM07347 from the National Institute of General Medical Studies for the Medical-Scientist Training Program.
Competing interests
None.
Provenance and peer review
Not commissioned; externally peer reviewed.
References
